Info Graphics
by lucanakin
Information graphics or info graphics are graphic visual representations of information, data, and knowledge.
These graphics present complex information quickly and clearly, such as in signs, maps, journalism, technical writing and education.
I’ve been asking from may people this question: You are Italian, can you make good coffe? I love coffe…
I found on the net a Info graphic that may interest you guys:
As a technology fan I would like to share with you this chart. Thos is a historical info graphic about the evolution of technology, but they talk about it in revolutionary term …
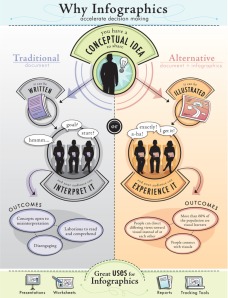
This chart explains how info graphics ease the process of communicating conceptual information. But, for my point of view we are going into an era when people.
Will become less intelligent and more and more visual causing a deficit of knowledge of the past and increasing knowledge of the future.
I’m not a very fun of apple product, I think they are overpriced and no affordable to everyone but,
I thought what follows here should be interesting: this chart shows the history of apple products from 1976 till now.
As a budding graphic designer could not be missed out a info graphic talking about colour, here:
SOURCES:
http://www.hongkiat.com/blog/50-informative-and-well-designed-infographics
http://www.inspiredm.com/20-essential-infographics-data-visualization-blogs/
http://www.good.is/infographics
http://www.infographicsshowcase.com
http://www.1stwebdesigner.com/inspiration/cool-infographics/


